I know that you’re excited to use website analytics to get better results and reach more people.
But I also know you’re wondering how to spark that same excitement in your boss and colleagues.
I know because the question comes up at every Google Analytics training I teach.
“How can I get my boss / colleague / Executive Director to start using analytics?”
Check out my answer below, complete with a handy demo chart!

1. Understand her perspective
Her mind / inbox / schedule / office are full of information and people, all competing for her attention.
New information is a heavy burden on her, because it requires more of her time and energy.
Data by itself is useless to her.
Thus, your job is to help her see that analytics data is going to be useful to her, while requiring very little of her time and energy.
2. Find what excites (or frustrates) her
You have two options for standing out from everything else that competes for her attention:
- Get her excited
- Solve her problem
I’ve had good luck with using analytics data to solve her problems.
- For my executive director, I demonstrated how our email fundraising analytics weren’t matching those of a direct competitor. I explained that we were leaving money on the table by not using analytics to improve our own email fundraising performance.
But I’ve also gotten her excited about data she didn’t even know she needed.
- For an events professional colleague, I showed her how we could use A/B testing to find the email subject line that would get more people to open the event invitation.
3. Identify the relevant data
What information would get her excited about analytics?
Or what information would solve her problem?
Look for just a few data points. Remember, you don’t want to take up too much of her time or mental energy.
For example, with my executive director, I focused on open rates and click through rates. With my events colleague, I only focused on open rates.
If you’re struggling to find which information to share with her, check out this resource: 6 Metrics I Track on Nonprofit Websites & Why They’re Important
4. Tell her a helpful story
This is the most important step: find a story within the data.
Find a story that will help her understand that analytics will be useful to her. The story is also the key to making the connection with minimal requirement of her time/energy.
What kind of story can you tell? Choose a simple, direct relationship: A led to B.
Your story should also include a recommendation.
“A led to B, thus we will improve A and expect to see improvements in B.”
5. Build the momentum of the story
As you know from your own work, analytics is an ongoing habit, not a one-time event.
Once you’ve engaged her with the first, simple story, you must share the next chapter of the story, and the next chapter, each more complex than the last.
For example, after testing subject lines in an email message, the next chapter might be testing a new layout.
Eventually, she will incorporate analytics into her workflow, but she needs your help to build the momentum.
6. An example, including demo data
The simplest story is one that you can tell with the information that’s readily available in Google Analytics.
So, open up GA, navigate to Behavior → Site Content → Landing Pages
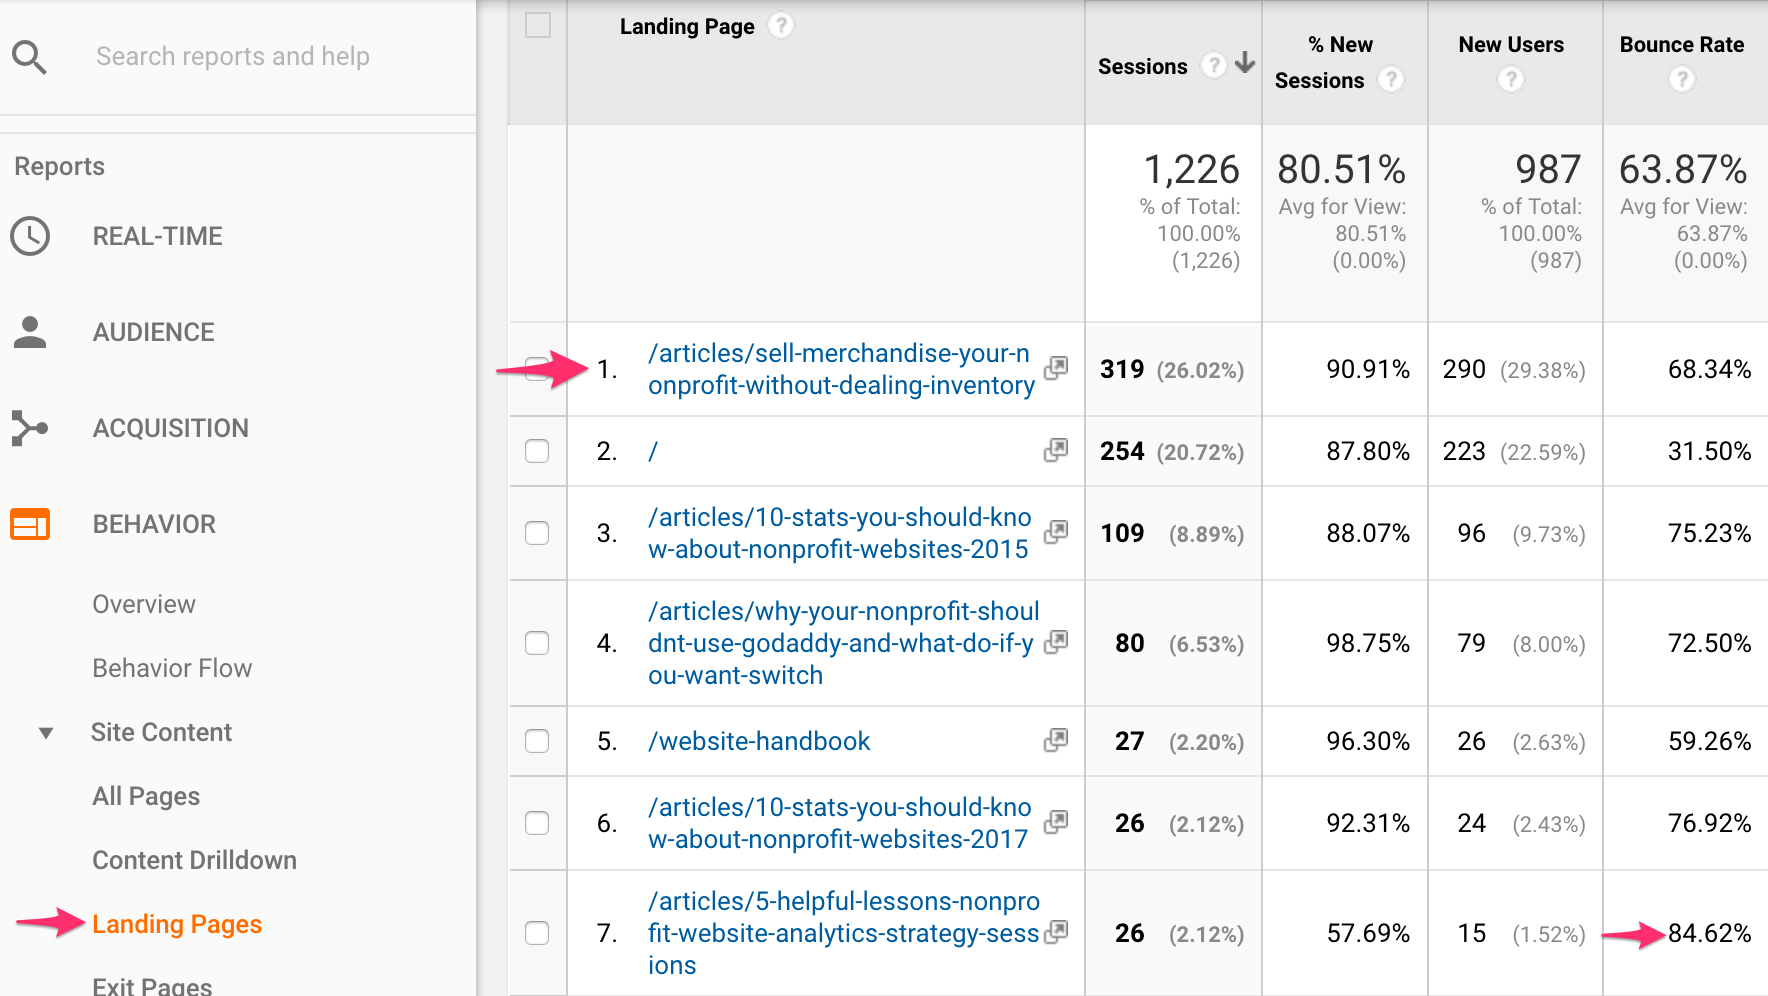
Look through the list of popular entry points to your website. Look at the bounce rate and time on page for each one.
What story can you tell using this information?
Do any of the pages stand out, either because they cover an unusual topic, or because you didn’t realize the topic was still so popular? For example, my “Sell Your Merchandise” article has been popular since 2012, even though I don’t focus on ecommerce! I know of several nonprofit websites where one specific blog post is a perennial top landing page.
Does one of the pages have a long time on page, or low bounce rate?
What recommendation can you make based upon this information?
You might recommend new blog posts to follow up on the topics covered in popular landing pages.
You might recommend overhauling a page with a very high bounce rate, to try and keep more people on the site.
My examples above are intended to spark ideas that would best fit your data and your boss.
Give your colleague / boss / executive director the data, along with your story and recommendation.
P. S. If you want to add Google Analytics to your resumé…
I’m teaching the Google Analytics Toolkit course again LIVE in October. You can grab all the recordings and resources right away, and join me in October for live classes to get answers for your specific questions.
