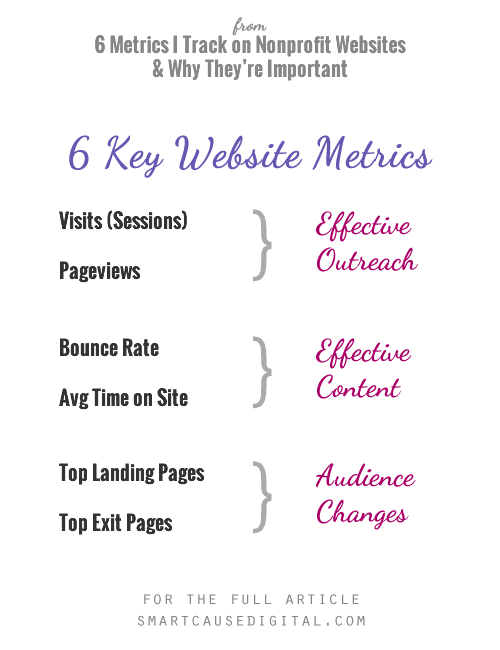
Don’t get overwhelmed by all the analytics information that’s available about your nonprofit website! Here’s your list of the 6 most important website analytics:
- Visits (now called Sessions in Google Analytics)
- Pageviews
- Bounce rate
- Average time on site
- Top landing pages
- Top exit pages
Together, these analytics help you understand the effectiveness of your outreach, the effectiveness of your content and the changing nature of your audience’s interests.
Effective Outreach
Visits (Sessions)
A visit/session represents a person browsing your site, regardless of how many pages they load.
Pageviews
A pageview represents one person looking at one page, one time. Pageviews are usually your biggest analytics number because they’re counted all the time, such as when a visitor refreshes the page.
Why they matter
Together, visits and pageviews help you understand the effectiveness of your outreach. If you are running a successful outreach campaign, you should see an increase in visits and pageviews.
Effective Content
Bounce Rate
A bounce rate represents the percentage of visitors who came to your site, loaded one page and left the site.
Average Time on Site
The time on site represents the length of time between when a visitor loaded their first page on your site and their last page on your site.
Why they matter
Together, bounce rate and average time on site help you understand the effectiveness of your content. If your site content is effective, you should see a lower bounce rate and a longer time on site.
Audience Changes
Top Landing Pages
A landing page is the first page that a visitor loads during their visit (session).
Top Exit Pages
An exit page is the last page that a visitor loads during their visit (session).
Why they matter
Together, top landing pages and top exit pages help you understand the changing interests of your audience. For example, in December your top landing page might include an article about keeping pets safe in the winter cold and in June your top landing page might including an article about keeping kids safe in the summer sun.
Are you monitoring these 6 key analytics?
If not, make sure you get my free Google Analytics dashboard. I compiled these 6 analytics (and a few extra goodies) into one easy-to-scan dashboard that you can use on your own Google Analytics account.
P.S. If you’re interested…
in learning how to use your analytics to improve your nonprofit website, enroll in my Smart Nonprofit Websites Course! It’s a three step plan to stop website overwhelm.

