We don’t need *all* the website analytics, we just want the analytics that are going to help us do a better job connecting with and inspiring our supporters when they visit our website. Here are a few key analytics for your donation webpage along with tips on why they matter and how to calculate them.
- How people find your donation page
- How many people visit your donation page… and then make a donation
- How many people visit your donation page… and leave immediately
- How many people visit your donation page… using a mobile phone or tablet
- How long people are spending on your donation page
How people find your donation page
WHY IT MATTERS
You want to know through which channels people *arrive* at your donation page so you can pay more attention to those specific channels that are working… and tweak the channels that aren’t working.
For example…
Did the visitor click on a link in your tweet?
Did the visitor come through the website’s homepage?
Is a local foundation linking from their website to your website’s donation page?
Are you seeing any traffic from that “fundraising website” where you created a profile for your organization?
HOW TO CALCULATE IT
(Note: The instructions in this article are for Google Analytics in November 2013. This tool changes all the time, so please proceed with caution if you are reading this article more than 6 months from the original publication date!)
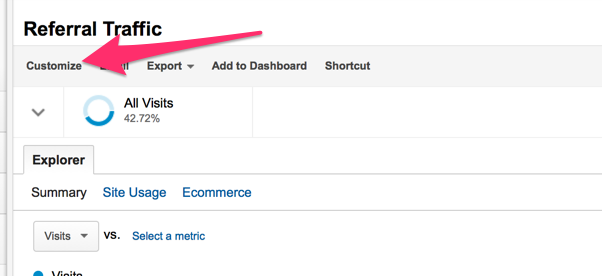
Start by finding the “referral traffic”
Click on “Acquisition” in the sidebar
Click on “All Referrals”
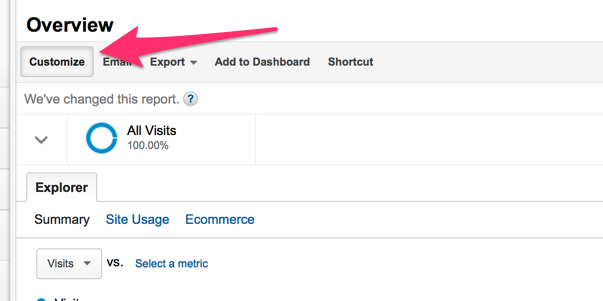
In the top area of the page, click “Customize”
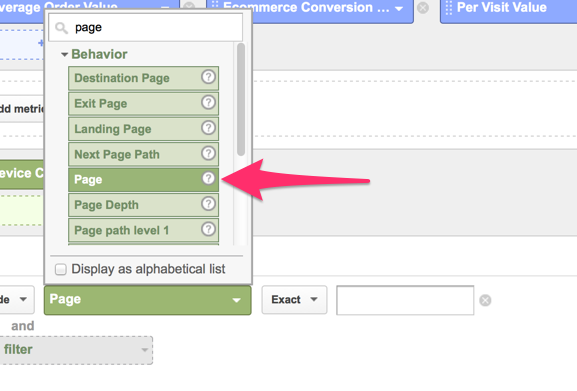
Scroll down and choose to “add filter”
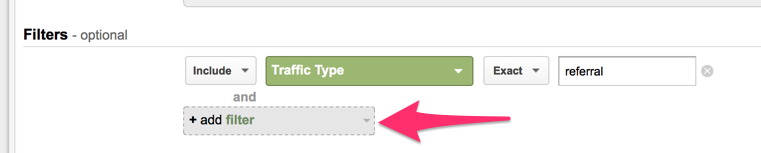
In the popup menu, click on “Behavior” and then “Page”
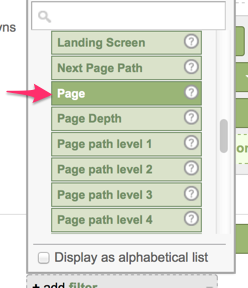
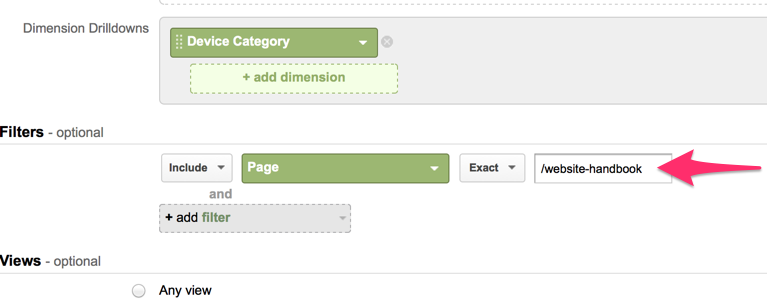
In the empty field, start typing the URL of the donation page and Google Analytics will help with auto complete
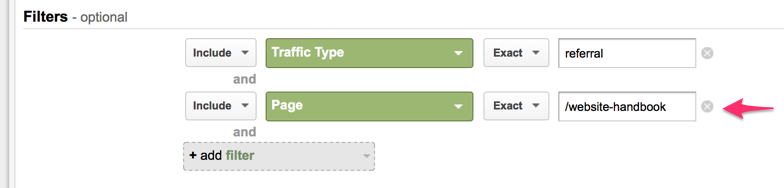
Save and review the list of sites that are sending visitors to your donation page
Remember you can “Add to dashboard” to save this view for later!
Next, head over to “Audience” and then “Visitors Flow” to see a visual demo of how people are clicking through your site. The display defaults to country, but you might prefer to see it grouped by page.
Click on “Country/Territory” and type “page” into the text field
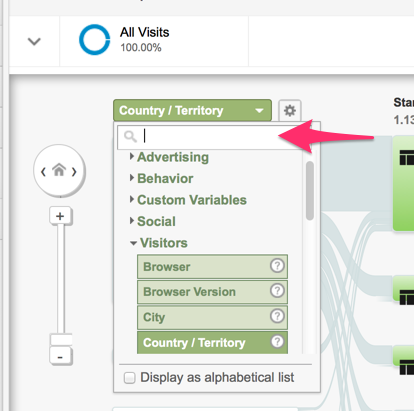
Choose “Landing Page”
You now see visitors grouped according to the first page they visit on your site. You can see what pages they visit next. Where is your donation page in this visitor flow?
How many people visit your donation page… and then make a donation
WHY IT MATTERS
This information helps you measure the effectiveness of your donation page. Tracking this information will also tell you if the modifications you make over time improve (or hurt) the donation page’s performance.
This measurement is called a conversion rate and it can vary widely. I’ve seen donation page conversion rates as low as 0.5% and as high as ~ 10%.
HOW TO CALCULATE IT
This one is simple: For a given time period, divide the number of donations by the number of pageviews to the donation page.
# of donations in november / # of pageviews to donation page in november = conversion rate
To find the number of pageviews to your donation page, click on “Behavior” then “Site Content” then “All Pages”. If your donation page is in the top 10 most popular pages, it will be listed immediately, along with the pageviews next to it. If the donation page is not popular, scroll down for the option to see the next 10 items, or to show more rows on this page.
How many people visit your donation page… and leave immediately
WHY IT MATTERS
This information is called a bounce rate and it helps you identify how compelling your donation page is. We want a low bounce rate for our donation page because that means a visitor stayed on our website and visited another one of our pages (hopefully a “Thanks for donating” page!)
What’s a high bounce rate? It depends, but anything over 70% is worth taking a closer look.
HOW TO CALCULATE IT
To find the bounce rate for your donation page, click on “Behavior” then “Site Content” then “All Pages”. If your donation page is in the top 10 most popular pages, it will be listed immediately, along with its bounce rate in one of the adjacent columns. If the donation page is not popular, scroll down for the option to see the next 10 items, or to show more rows on this page.
How many people visit your donation page… using a mobile phone or tablet
WHY IT MATTERS
If your site is not yet responsive, this data is hard evidence that your site needs to be responsive! Every single nonprofit website I’ve worked on has seen a dramatic rise in the percentage of visitors who are using mobile devices or tablets over the last two years.
If your site is already responsive, you can use this data to determine how to prioritize the layout of the donation form. For example, I recently ran the analytics on a nonprofit website and it now has 52% of all visits coming from a mobile device or tablet. That nonprofit’s donation form layout should absolutely be optimized for mobile visitors above all other visitors!
HOW TO CALCULATE IT
Click on “Audience” then “Mobile” then “Overview”
In the top area of the page, click “Customize”
Scroll down and choose to “add filter”
In the popup menu, click on “Behavior” and then “Page”
In the empty field, start typing the URL of the donation page and Google Analytics will help with auto complete
Save and review the mobile data
Remember you can “Add to dashboard” to save this view for later!
How long people are spending on your donation page
WHY IT MATTERS
For the donation page with the actual form, we want donors to get through it quickly because that usually means the process was easy. If you see that donors are spending more than 2 or 3 minutes here, what can you do to streamline the process?
For the donation page that “makes the case” before a donor is sent to the actual donation form, a longer time spent on the page might indicate that your content is interesting and compelling. You just want to monitor the time spent on this page and compare it with the conversion rate. If the time on page starts falling… and the conversion rate is falling at the same time, you need to make a stronger case!
HOW TO CALCULATE IT
To find the average time a visitor spends on your donation page, click on “Behavior” then “Site Content” then “All Pages”. If your donation page is in the top 10 most popular pages, it will be listed immediately, along with the average time on page in a column next to it. If the donation page is not popular, scroll down for the option to see the next 10 items, or to show more rows on this page.
